The Oblong on the Wall
Why give colour a whole series of its own? Because it is the most familiar thing in the world that turns out, on inspection, not to be where you think it is. It is not quite a property of objects; it is not even, as we will spend these seventeen posts arguing, a property of light. It is something the eye and brain construct — and almost everything strange about colour follows from a single fact, that the boundless variety of light is crushed, at the back of the eye, down to just three numbers. This series is the story of that collapse, told in order and with the mathematics kept in plain sight. It begins where the science itself began: with a young man, a borrowed prism, and a stripe of light that came out the wrong shape.
Isaac Newton was twenty-three, and he had nothing to do. The plague had closed Cambridge in the summer of 1665, and he had taken the long coach north to his mother’s farmhouse at Woolsthorpe, in Lincolnshire, with no lectures to attend and no tutor to satisfy. He spent the next year and a half thinking, more or less without interruption, harder than almost anyone has thought before or since. The calculus comes from these months. So does the first real grip on gravitation. And so does a small experiment with a piece of glass that would crack open the whole of optics.
He drilled a hole in the shutter of an upstairs room, a hole “about a third part of an inch broad,” and let a single pencil of morning sunlight into the dark. Into that beam he set a triangular glass prism, bought — the story goes — at the Stourbridge fair, and he turned to watch where the light landed on the far wall, some twenty-two feet away. He expected a patch of colour. Everyone knew prisms made colour; that was the cheap parlour trick the glass was sold for. What he did not expect was the shape. A round hole, casting a round spot, refracted through the prism, should by every rule of refraction he knew have produced a round image, only displaced and tinted. Instead the image on the wall was a ribbon — red at one end, violet at the other, and “oblong,” he wrote, about five times taller than it was wide.
That word, oblong, is the crack through which three centuries of optics would pour. A round hole had become an oblong smear. The only way that happens is if the white light entering the prism is not one thing being coloured by the glass, but many things being sorted by it — each colour bent through its own angle, the whole fan of them spread out along the wall. The colour was not added by the prism. It was already there, latent in the white, and the prism merely pulled it apart.
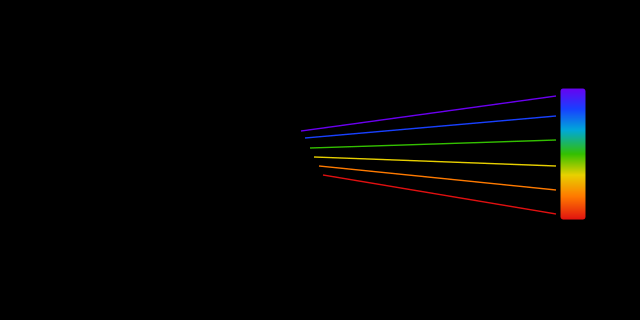
Newton’s first arrangement: a single beam of sunlight from a hole in the shutter strikes one prism and fans out across the far wall into the oblong spectrum, red bent least and violet bent most. A round hole has cast an elongated ribbon — the shape that gives the whole experiment away.
A line from white to black
To feel why the oblong landed like a thunderclap, you have to know what it overturned, and the system it overturned was old, deep, and genuinely beautiful.
For more than two thousand years the standard Western account of colour was Aristotle’s, and Aristotle’s colour space was a line. Every colour, he held, lay somewhere on a single axis running from pure white at one end to pure black at the other, with the chromatic colours strung between them like beads — yellow near the bright end, then red, green, blue, and a deep purple sliding down toward the dark. In De Sensu he lists them in order; the order wobbles from manuscript to manuscript, but the structure never does. Colour was a one-dimensional thing, a single dial from light to dark, and the hues were stops along the way.
This was not stupidity. It was a faithful reading of the materials at hand. Ask why green sat down near the dark end of the line and yellow up near the light, and a large part of the answer is simply: those were the colours one could get. The classical palette — recovered in detail by Humphry Davy, who in 1815 analysed pigments scraped from the ruins of Pompeii — was a catalogue of earths and minerals: yellow and red ochre, the iron oxides; white lead and gypsum; lampblack and bone black; cinnabar and red lead; the poisonous arsenic yellows; malachite and verdigris for green; azurite for blue; and the world’s first synthetic pigment, Egyptian blue, sintered from sand, lime, and copper since around 3100 BCE. A bright, fast, saturated green was chemically hard to make; a saturated blue harder; a saturated purple so hard that Tyrian purple, wrung from sea-snails, was literally worth its weight in silver. The pigments you could mix vivid clustered toward yellow and red; the ones that came out dull and dark clustered toward blue and green. Aristotle’s line, in part, is a map of a paint box. It encodes not the structure of light but the structure of what the ancient world could grind, fire, and suspend in oil — which is a different thing entirely, and one of the oldest lessons in this whole subject is how easily the two get confused.
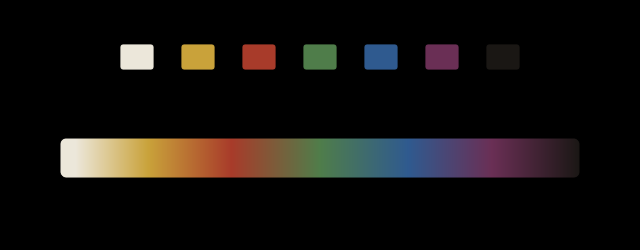
Aristotle’s linear colour scale: a single axis from white through yellow, red, green, and blue to black. The chromatic hues are stops on one dimension; lightness and what we now call saturation are not yet distinguished.
The Renaissance refined the picture without breaking it. In 1435 Leon Battista Alberti, in De Pictura, proposed four “true” colours tied to the four elements — red for fire, blue for air, green for water, grey-ash for earth — and made the quietly radical move of declaring white and black not colours at all but “alterations,” modifiers that lighten or darken any true colour. That is the first clear separation, in Western art theory, of hue from lightness: the recognition that “how blue” and “how bright” are different questions — that a colour might hold its identity while sliding up and down in brightness, which is to say that colour wants more than one dimension to live in. Leonardo, a few decades later, listed six simple colours and worried at a loose thread — mixing a yellow pigment with a blue one gives green, so perhaps green was not simple after all. He was circling, without quite naming it, the difference between mixing light and mixing paint, a distinction we will need much later when we ask why a colour printer needs black ink. The painters were ahead of the philosophers here, as painters often are about colour: they handled the stuff daily and felt its extra dimensions in the hand before anyone could write them down.
But all of it — Aristotle, Alberti, Leonardo — kept the founding assumption: that white is simple, an indivisible primitive, the colourless ground from which colour is somehow produced. Newton’s oblong said the exact opposite. White was not simple. White was a crowd.
The crucial experiment
Decomposition alone would not have settled it. Newton’s critics — and there were many, led by Robert Hooke, who as the Royal Society’s curator of experiments considered himself the standing authority on light — could shrug and say the prism manufactured the colours, dyeing the white light as it passed through the glass, with the oblong shape just some artefact of the beam. This was not an unreasonable thing to believe. Hooke had his own theory, in which colour was a disturbance introduced into a pulse of light by its passage through a refracting body — colour as a kind of bruise the glass left on the beam. On that view a prism was indeed a colour factory, and the spectrum was its product, not its inventory. Newton had to rule the factory out. The experiment that did it he called, borrowing a phrase of Bacon’s by way of Hooke’s own Micrographia, the experimentum crucis: the experiment at the crossroads, the one that forces the choice.
It runs in two moves. First, the second prism. Take the fan of colour thrown by the first prism and pass the whole of it through a second prism turned the opposite way. If the prism were a colour factory, a second factory should make things more colourful, or at least no less. Instead the second prism gathers the fan back up and recombines it into a spot of white. The colours fold back into the white they came from. You can take white apart and put it back together; the colours were its parts all along.
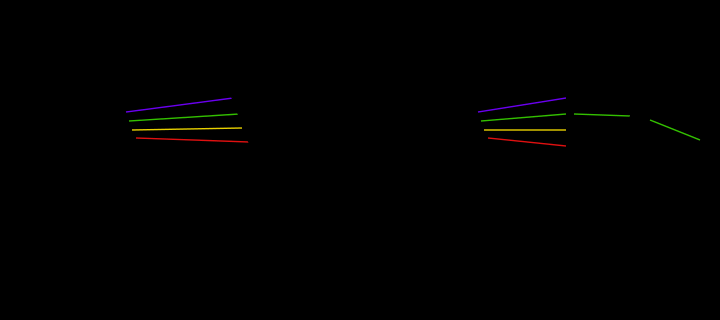
The experimentum crucis, redrawn from the plate in Opticks, in two panels. Left: a first prism fans white light into the spectrum, and a second prism, inverted, gathers the fan back into a spot of white — white light is a mixture, and the mixing is reversible. Right: a screen with a small hole isolates a single band of the spectrum (here, green); a third prism bends that band but cannot spread it further or change its colour — the spectral colours are atomic to the prism.
Then the third move, the one that clinches the character of the parts. Pierce a small hole in a screen placed in the spectrum, so that only a single colour — say, a narrow band of green — passes through. Send that isolated green through a third prism. It bends, because all light bends through a prism; but it does not spread, and it does not change colour. Green goes in, green comes out, refracted by exactly the amount that green is always refracted by and never any other. The first prism could split white into colours. No prism can split a colour into anything finer. The spectral colours are, to the prism, atomic.
Both halves of the crucial experiment are worth doing with your hands rather than taking on trust. In recombine mode below, slide the inverted second prism into the fan until the colours fold back into a single white spot; then switch to the single-band test, let the slit pick out one colour, and watch the third prism bend it without ever splitting it again.
P-A — the experimentum crucis, made interactive. Drag the second prism into the spectrum and the fan recombines to a white spot — white light is a reversible mixture. Switch to the single-band test and a once-separated colour only bends, never spreads. (The recombined patch is drawn white rather than additively mixed; the two facts it demonstrates are exact.)
From this Newton drew the law that anchors the whole edifice, stated in Opticks with the cadence of a slogan: to the same degree of refrangibility there ever belongs the same colour, and to the same colour the same degree of refrangibility. Each ray has its own fixed bending. Sort by bending and you sort by colour; the two are locked together. We can sketch the mechanism, even though Newton could only observe it. A prism of apex angle and refractive index deviates a ray, at minimum deviation, by an angle satisfying
The trick is that is not a constant. Glass refracts short wavelengths more than long ones — its index runs with wavelength, — and the empirical shape of that dependence is captured, to first approximation, by the form
which Augustin-Louis Cauchy (1789–1857) would write down only in 1836, a century and a half after Woolsthorpe, with and positive constants fitted to a given glass. The physical reason behind that algebraic shape is that the electrons bound inside the glass have natural resonant frequencies up in the ultraviolet; light of shorter wavelength sits closer to those resonances, the electrons respond more sluggishly in step with the field, and the effective index climbs. The is the leading term of an expansion around a resonance the eye cannot see. What matters for the wall is only the sign: because , the index falls as grows, so violet (short) is bent hardest and red (long) least. Feed through the deviation law and inherits the wavelength dependence — each colour leaves the prism on its own heading, and the round spot smears into Newton’s oblong, violet crowded to one end and red to the other in exactly the order the formula demands. The dispersion of the glass is the whole story of the shape, and Newton read the shape correctly long before anyone could write the curve that governs it.
He published all this first not in Opticks but in a letter — a vivid, almost conversational letter to Henry Oldenburg at the Royal Society, dated 6 February 1672, printed that month in the Philosophical Transactions as A New Theory about Light and Colors. The reception was brutal. Hooke read the paper aloud to the Society and dismissed it in a matter of days, insisting it could all be reconciled with his own pulse theory and that Newton had merely dressed up old ideas. Worse came from abroad. The continental experimenters set out to repeat the crucial experiment, and the most influential of them, the French physicist Edme Mariotte (1620–1684), reported in 1681 that it failed: a single colour passed through a second prism, he claimed, came out fringed with new colours after all, so the spectral rays were not pure and immutable as Newton had sworn. Mariotte was a careful man and the most respected experimentalist in France, which is precisely why the botch mattered so much. He had used a coarse, scattering prism and a beam he had never properly narrowed, so that stray light from the edges of his slit re-entered the second prism and painted the fringes he then blamed on the light. The error was invisible without Newton’s obsessive care over apertures and distances — and because it came from an authority, it hardened into the continental consensus for nearly half a century. The lesson is one the series will meet again in other costumes: a crucial experiment is only as crucial as the cleanliness of the hands that repeat it, and a prestigious failed replication can bury a correct result for a generation. The dispute turned personal, dragged on for years, and soured Newton so thoroughly on the whole business of publishing that he sat on the full theory for three decades. Opticks did not appear until 1704 — the year after Hooke died.
There is a coda worth planting now, because it pays off late in the series. The poet and statesman Johann Wolfgang von Goethe (1749–1832) would, a century on, mount a furious book-length assault on Newton’s optics, insisting from his own observations that colour arises at the boundary between light and dark and cannot be a mere catalogue of rays. About the physics Goethe was simply wrong; the rays are real and the slogan holds. But about the perception of colour — about the way the eye conjures hue at edges, pairs colours into opposites, and refuses to behave like a passive wavelength meter — he was seeing something true that Newton’s theory had no room for. We will let Newton keep the light and give Goethe his due when the eye’s own arithmetic turns out to take colour apart into opposing channels. He was wrong about the physics and right about the perception, and both halves of that verdict will matter.
Seven colours, seven notes
Here is a thing worth getting right early, because the whole series will lean on it. Look at a spectrum — really look, at a good one — and try to count the colours. You cannot. Red shades into orange shades into yellow with no seam anywhere; the spectrum is a continuum, a smooth slide of wavelength with no internal joints. The number of colours in it is, honestly, whatever you decide to call out. So where does the famous seven — red, orange, yellow, green, blue, indigo, violet — come from?
It comes from music.
In his first letter, in 1672, Newton named only five principal colours: red, yellow, green, blue, violet. By the time of Opticks he had expanded the list to seven, and he was candid about why. He wanted the colour circle he was building to echo the musical scale — to divide the spectrum the way an octave is divided into seven intervals. In Opticks he literally instructs the reader to mark off the circle’s circumference into seven arcs “proportional to the seven musical Tones or Intervals” of the scale, and the arcs are deliberately unequal, their widths matched to the whole-tones and semitones of the Dorian mode. Orange and indigo were added not because anyone could reliably see a band there, but because five notes were not seven, and Newton — heir to an old Pythagorean dream of a cosmos tuned in harmonic ratios — wanted the colours of light to chime with the harmony of sound.
The circle was more than a mnemonic, though, and this is the part worth dwelling on. Newton bent the straight spectrum round into a ring and closed the gap between the two ends — between red and violet — with the purples, which are not spectral colours at all but blends the prism never produces. Then he put white at the centre, and gave a rule for mixing: to find the colour of any mixture of lights, place a weight at each component’s position on the rim, in proportion to how much of that light is present, and find their centre of gravity. The mixture sits there. A mixture lands near the rim when it is dominated by one hue, and drifts toward the white centre as you pile in more components from around the wheel. This is the first quantitative theory of colour mixing ever written down — a recipe that takes a list of lights and returns a single point standing for what the eye will see. The construction is the direct ancestor of the diagram we will build, with three centuries of refinement, in the fifth post; the centre-of-gravity rule survives into modern colour science almost unchanged, and we will derive it properly there.
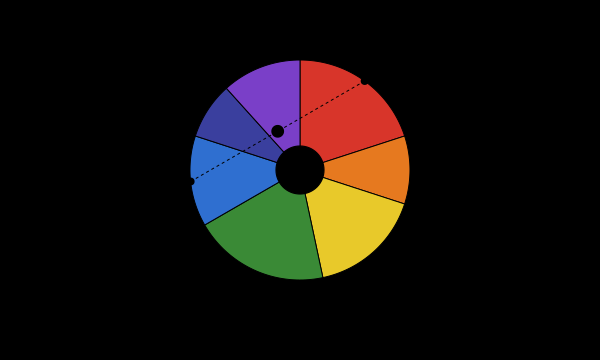
Newton’s seven-colour circle from Opticks, with the diatonic interval spacing that set the band count and white at the centre. The seven arcs are unequal, their widths chosen to match the tones and semitones of the musical scale; the gap between red and violet is bridged by the non-spectral purples. A mixture of lights sits at the weighted centre of gravity of its components — the first quantitative rule for colour mixing.
Newton knew the spectrum was a continuum; he said as much, that it had as many colours as there are rays of differing refrangibility, which is to say infinitely many. The seven names are a grid laid over a continuous thing, a convention chosen for its resonance with music, not a fact read off the light. And the grid fits badly even on its own terms. The “indigo” of ROYGBIV is the awkward survivor — a band most people cannot pick out as distinct from its neighbours, kept alive in the mnemonic only because Newton needed a seventh note. What he called “blue” is closer to what we would call cyan; his “violet” sits where we would say blue. The recited rainbow is a seventeenth-century aesthetic decision wearing the costume of a measurement.
This is the first appearance of a theme that will run all the way to the last post in the series: the names we give colours are conventions, not facts of physics. Different cultures cut the spectrum at different places and in different numbers, and there is no privileged grid the light itself prefers — a point we will come back to when we ask how languages carve up colour. Hold onto the suspicion. It is going to pay off.
A sliver in the spectrum
Newton had the visible spectrum, red to violet, splayed out on his wall. The natural next question is whether the wall caught all of it — whether the ribbon was the whole of the light, or only the part the eye happens to register. The answer, found at both ends within a single year, is that the eye catches almost nothing.
In 1800 the astronomer William Herschel — the man who had found Uranus, and who built the finest telescopes of his age — stumbled onto the first half of the answer while trying to solve a practical nuisance. Herschel spent long hours observing the Sun, and he needed coloured glass filters to cut the glare without cooking his eye at the telescope. He had noticed that the filters behaved oddly: some passed plenty of light but little heat, others the reverse, as though heat and brightness did not travel together through the spectrum. To pin the effect down he spread a spectrum with a prism and laid a thermometer in each band of colour to read its “heating power,” with a second and third thermometer set off to the side, outside the light, as controls to track the room temperature. The reading climbed steadily as he moved a thermometer from the violet end toward the red. The crucial inference was his next thought: if the heating power was still rising as he reached the red, the trend had not yet peaked, and a sober experimenter follows a trend to see where it turns over. So he parked a thermometer just past the red end, in the dark, where it was supposed to be measuring nothing but ambient air — and found it reading higher than any thermometer sitting in visible colour at all. There was light there. It warmed a thermometer, it had been refracted by the prism just like the visible kind, only bent a little less, and no eye could see it. Herschel had found infrared by trusting the slope of a curve past the edge of what he could see.
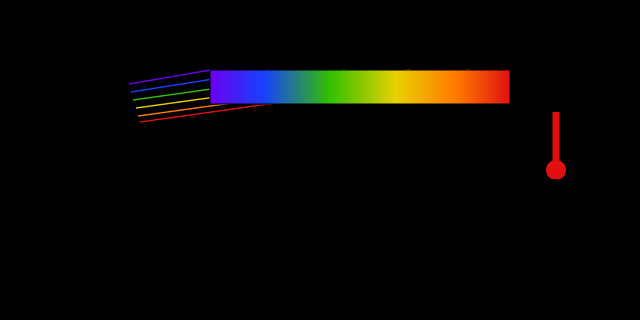
Herschel’s apparatus (1800): a prism casts the spectrum across a row of thermometers, with the warmest reading falling beyond the red end, in the region the eye registers as nothing. The first evidence of light we cannot see.
The other end fell the next year, and it fell on purpose. Johann Wilhelm Ritter was a young German physicist steeped in Naturphilosophie, the Romantic conviction that nature is built on symmetry and polarity — that every force has its opposite, every pole its counter-pole. Where Herschel had followed a measurement, Ritter followed a metaphysics. When Herschel’s invisible heat-rays turned up beyond the red, Ritter reasoned that nature could hardly leave the other end of the spectrum bare: if there were rays past the red, there ought to be complementary rays past the violet, opposite in character. Heat was, in his scheme, the “deoxidising” pole; he went looking for an “oxidising” or chemical pole at the far end. The reasoning was, by any modern standard, mystical — and it pointed him at exactly the right place to look, which is a reminder that a wrong theory can still aim the telescope true. He already knew the right detector. Silver chloride, the light-sensitive silver salt that is the ancestor of the photographic plate, darkens when light falls on it, and it darkens faster under blue and violet than under red. Ritter laid a strip of it across the spectrum and watched: the darkening grew stronger toward the violet, and then — exactly as his belief in polarity had predicted — it grew stronger still in the dark region just beyond the violet, where the eye saw nothing. Invisible light again, more energetic this time, driving chemistry the visible colours could barely manage. Ritter had found ultraviolet. The visible spectrum was not the spectrum. It was a window cut into something far larger, with darkness on both sides that was not darkness at all.
And around the same time Thomas Young, using the delicate interference fringes of Newton’s rings, did the thing that turns all of this from qualitative into quantitative: he measured the wavelength of light. He found that the colours corresponded to lengths of order five hundred billionths of a metre — that “red” and “violet” were, at bottom, just longer and shorter rulers. Colour had become a number, a length. We will adopt Young’s units throughout: wavelengths in nanometres (nm), where , and we will take the visible band to run roughly from at the violet end to at the red, with a tighter working range of – where the eye’s sensitivity is appreciable. A wavelength of green light, around , is comparable in size to a small bacterium — far below anything the eye could ever resolve directly.
Once you know the lengths, you can lay the visible band down inside the whole electromagnetic spectrum and look at the proportions. That is worth doing not in prose but with your hands.
Drag the axis below to pan across the electromagnetic spectrum, and zoom out — each step is a factor of ten in wavelength. Watch what happens to the coloured band as the radio waves, the microwaves, the X-rays and gamma rays come into view on either side.
W-01 — the electromagnetic spectrum on a logarithmic wavelength axis. Pan and zoom; the visible band (380–780 nm) is highlighted, with Herschel’s infrared and Ritter’s ultraviolet marked just outside it, and the photon energy in electron-volts read off above.
The point the widget makes with its own geometry is hard to convey any other way: the colours we can see occupy a band less than one octave wide — barely a doubling of wavelength from end to end — inside a spectrum that runs across some twenty-odd octaves of radio, microwave, infrared, ultraviolet, X-ray, and gamma. Everything we have ever seen, every colour in every painting and sunset and screen, lives in that one thin sliver. The eye is not a window onto the light. It is a very narrow slit.

The electromagnetic spectrum on a log-wavelength axis, with the 380–780 nm visible band marked as a sliver between the long-wavelength radio and infrared and the short-wavelength ultraviolet, X-ray, and gamma regions. The static companion to W-01.
What a photon carries
Why that slit, though? Why does the eye answer to this particular octave and ignore the twenty on either side? Part of the answer is evolutionary and waits for the next post, but part of it is pure physics, and it is the physics that closes this post.
Light comes in lumps. Each lump — each photon — carries an energy fixed entirely by its wavelength,
where is Planck’s constant and the speed of light. The energy runs inversely with wavelength: short waves, energetic photons; long waves, feeble ones. It is convenient to measure these energies in electron-volts (eV), the energy one electron gains crossing a one-volt drop, because the numbers then come out human-sized. The conversion is worth carrying out once by hand, so the band’s energies feel earned rather than asserted. Take a green photon at . With and ,
and dividing by the electron charge turns that into about . Run the two ends of the band through the same arithmetic and you get photons carrying from about at the violet end () down to about at the red () — green sitting, as it should, squarely between.

Photon energy against wavelength across the visible band, from ≈3.1 eV at 400 nm to ≈1.8 eV at 700 nm, with the band of typical covalent-bond energies overlaid. Visible photons carry roughly the energy of a chemical bond.
Now hold that range — one to a few electron-volts — against the energy it takes to do something to a molecule. The covalent bonds that hold organic matter together, and the gaps between the energy levels of the electrons that form them, sit in almost exactly the same range: a few electron-volts apiece. That coincidence is not a coincidence at all; it is the reason vision exists. A visible photon carries just enough energy to flip a molecule from one state to another — to bend the retinal molecule in a cone cell, to expose a grain of photographic film, to drive a step of photosynthesis, to break a bond in the DNA of a sunburned cell at the ultraviolet end. It is energetic enough to be detected by chemistry, and that is what it means to be seen.
An infrared photon, down at a fraction of an electron-volt, cannot do this. It lacks the energy to trip the molecular switch; all it can do is jostle the molecule a little harder, which we feel as warmth. This is the resolution of Herschel’s puzzle. The light past the red warmed his thermometer but lit up no eye, because warming is what low-energy photons do and seeing is what few-electron-volt photons do, and the difference is set photon by photon, not by how much light there is in total. A faint violet glow can fade a curtain that a blazing infrared lamp leaves untouched, because fading is photochemistry and only the violet photons each carry enough to break a bond. The threshold lives in the single photon. Crank up the intensity of the wrong-colour light all you like; you are sending more lumps, but no lump is big enough, and nothing chemical happens.
So the eye’s narrow slit is not arbitrary after all. It sits at the one place in the spectrum where each photon carries roughly the energy of a chemical bond — energetic enough to be registered by a molecule, gentle enough not to tear that molecule apart on every encounter. Life builds detectors where the photons are the right size, and the right size is a few electron-volts, and a few electron-volts is precisely the visible band. The sliver is where the chemistry of seeing is possible.
Colour is not in the light
Return, now, to the oblong on the wall, and ask the question Newton kept circling back to: where, in all of this, is the colour?
Not in the prism, which only sorts. Not, it turns out, in the light. Trace the chain we have built. A spectral colour is a wavelength; a wavelength is a length, a number, an energy carried in photon-sized lumps. There is nothing red about a photon. It is a packet of electromagnetic field oscillating at a certain rate, carrying , and that is the entire physical fact of the matter. “Red” is not in that description anywhere. Redness is something that happens afterward, when such a photon reaches an eye and a nervous system renders a verdict.
Newton saw this, and he did not arrive at it by argument alone. The most extraordinary entry in his notebooks records the lengths he went to in order to test it. He wanted to know whether colour could be conjured without any light at all — for if it could, then colour plainly belonged to the seeing, not to the seen. So he took a bodkin, a smooth blunt needle of the sort used for threading ribbon, and slid it gently between his eyeball and the bone of the socket, until he could press on the back of the eye and distort its shape. Light played no part; the room need not even have been lit. And yet, as he pressed, he saw coloured circles and rings bloom in his vision — “white, darke & coloured circles,” he wrote, sketching them carefully. These are phosphenes: colour sensations produced by mechanical pressure on the retina rather than by any incoming ray. (He recovered, after some days of disturbed vision; the experiment is one no one should repeat.) The logic of the thing is worth making explicit, because it is the whole argument in miniature. The photoreceptors at the back of the eye do not measure wavelength; they fire when they are disturbed, and a blunt needle disturbs them as surely as a photon does. The brain, receiving the same kind of signal it always receives, returns the same kind of verdict it always returns — colour — even though no colour, and no light, ever entered the eye. If pushing on an eye in the dark can make you see hue, then hue is something the visual system generates from its own firing, not something it merely reads off the world. The circles were the proof he was after.
There is a quiet irony in those circles. A generation later it was another set of “circles” — Newton’s rings, the delicate interference fringes that form in a thin film of air between a lens and a flat plate — that let Thomas Young pin down the wavelength of light by measurement alone, no eyeball required. The same Newton who risked his sight pressing rings into his own retina had, elsewhere in his optics, left behind the bloodless rings that would turn colour into a number. Newton got at the mind with a needle; Young got at the wavelength with a lens.
This is the thesis of the whole series, and we will state it once, here, and then spend seventeen posts earning it:
Colour is not a property of light. It is a verdict the eye returns.
It is worth being clear about how strong a claim this is. It is not the mild observation that perception is subjective. It is the structural claim that the infinite, continuous variety of physical light — a function over wavelength, a point in an infinite-dimensional space — gets collapsed, somewhere between the world and the experience, down to the small finite thing we call colour. Almost everything strange and difficult in colour science is a downstream consequence of that collapse: that wildly different physical spectra can look identical; that no set of real coloured lights can reproduce every colour we see; and, at the far end of the series, that there exist colours no light can produce at all — colours with no spectrum and no name. That all of this is even possible is the surest sign that the colour was never in the light to begin with.
Newton’s oblong told us the light is a crowd. The harder lesson is the one he reached with a bodkin behind his own eye and stated in cold prose in Opticks: that the crowd of wavelengths is only raw material, and the colour is made somewhere else.
Where, exactly? In a patch of tissue at the back of the eye smaller than the full stop at the end of this sentence, and in the brute fact that it contains exactly three kinds of cell.
Next: why three kinds of cone are enough to build every colour you have ever seen.